Prometheus监控ActiveMQ

这里只是对prometheus监控ActiveMQ的配置过程做个记录,方便以后查阅。

1.下载jmx_exporter

github地址:https://github.com/prometheus/jmx_exporter/releases

新建一个目录,用于存放jmx_exporter和config配置

1
2
3
[admin@haifly-bj-activemq2 ~]$ mkdir jmx_exporter
[admin@haifly-bj-activemq2 ~]$ cd jmx_exporter
[admin@haifly-bj-activemq2 jmx_exporter]$ wget https://repo1.maven.org/maven2/io/prometheus/jmx/jmx_prometheus_javaagent/0.12.0/jmx_prometheus_javaagent-0.12.0.jar

2.创建avtivemq.yml 配置文件

github地址:https://github.com/prometheus/jmx_exporter/blob/master/example_configs/activemq.yml

1
2
3
4
5
6
7
8
9
10
11
12
13
14
15
16
17
18
19
20
21
22
23
24
25
26
27
28
29
30
31
32
33
34
35
36
37
[admin@haifly-bj-activemq2 jmx_exporter]$ vim activemq.yml

lowercaseOutputName: true
lowercaseOutputLabelNames: true
blacklistObjectNames:
- "org.apache.activemq:clientId=*,*"
whitelistObjectNames:
- "org.apache.activemq:destinationType=Queue,*"
- "org.apache.activemq:destinationType=Topic,*"
- "org.apache.activemq:type=Broker,brokerName=*"
- "org.apache.activemq:type=Topic,brokerName=*"

rules:
- pattern: org.apache.activemq<type=Broker, brokerName=(\S*), destinationType=Queue, destinationName=(\S*)><>(\w+)
name: activemq_queue_$3
attrNameSnakeCase: true
labels:
destination: $2

- pattern: org.apache.activemq<type=Broker, brokerName=(\S*), destinationType=Topic, destinationName=(\S*)><>(\w+)
name: activemq_topic_$3
attrNameSnakeCase: true
labels:
destination: $2

- pattern: org.apache.activemq<type=Broker, brokerName=(\S*)><>CurrentConnectionsCount
name: activemq_connections
type: GAUGE

- pattern: org.apache.activemq<type=Broker, brokerName=(\S*)><>Total(.*)Count
name: activemq_$2_total
type: COUNTER

- pattern: org.apache.activemq<type=Broker, brokerName=(\S*)><>(.*)PercentUsage
name: activemq_$2_usage_ratio
type: GAUGE
valueFactor: 0.01

3.修改activemq 启动配置

修改 activemq_home/bin/env 文件

增加

-javaagent:/work/admin/jmx_exporter/jmx_prometheus_javaagent-0.12.0.jar=51616:/work/admin/jmx_exporter/activemq.yml

1
2
3
[admin@haifly-bj-activemq2 ~]$ vim apache-activemq-5.11.1/bin/env

ACTIVEMQ_OPTS="$ACTIVEMQ_OPTS_MEMORY -javaagent:/work/admin/jmx_exporter/jmx_prometheus_javaagent-0.12.0.jar=51616:/work/admin/jmx_exporter/activemq.yml -Djava.util.logging.config.file=logging.properties -Djava.security.auth.login.config=$ACTIVEMQ_CONF/login.config"

修改完重启activemq服务

1
sudo systemctl restart activemq

4.修改prometheus配置

1
2
3
4
5
6
7
8
9
10
- job_name: 'activemq'
static_configs:
- targets: ['192.168.4.58:9100']
labels: {cluster: 'product',type: 'basic',env: 'activemq',job: 'activemq1',export: 'activemq'}
- targets: ['192.168.4.58:51616']
labels: {cluster: 'product',type: 'middle',env: 'activemq',job: 'activemq1',course: "activemq",export: 'jmx_export'}
- targets: ['192.168.1.231:9100']
labels: {cluster: 'product',type: 'basic',env: 'activemq',job: 'activemq2',export: 'activemq'}
- targets: ['192.168.1.231:51616']
labels: {cluster: 'product',type: 'middle',env: 'activemq',job: 'activemq2',course: "activemq",export: 'jmx_export'}

5.重启prometheus

如果开启了api管理功能,可以如下方式热加载配置

1
curl -X POST http://127.0.0.1:9090/-/reload

6.grafana出图

推荐使用10702

效果如下

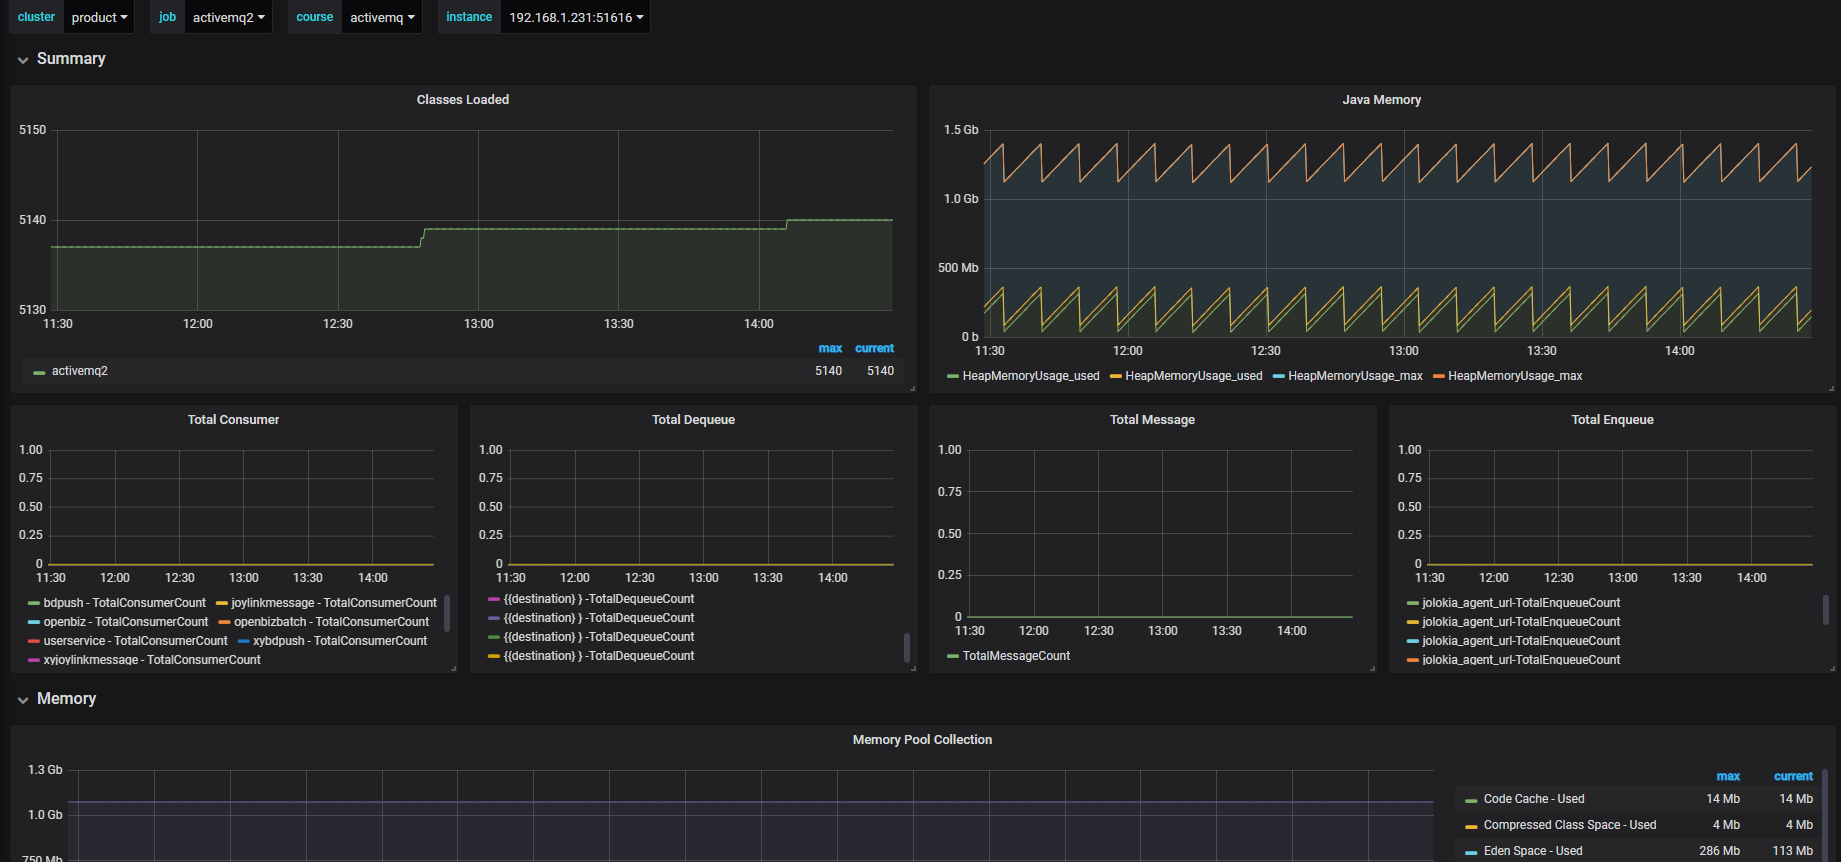
上图面板经过一定的修改可能略有不同,仅供参考

-------------本文结束感谢您的阅读-------------